Share EZ Charts publicly
In this article, you will learn how to share EZ Charts publicly.
Before you begin
To learn how to open EZ Charts window from templates page in SPAN sports performance analysis platform, refer to this article.
To learn how to access EZ Charts for a file, refer to this article.
To learn how to access EZ Charts for a file, refer to this article.
Share EZ Charts publicly

Note: After opening the EZ Charts for a file, the default URL is always private and cannot be shared publicly.
To make the EZ Charts public and accessible to non-users of BanyanBoard, add public in the URL after /#/ and before /assets/.
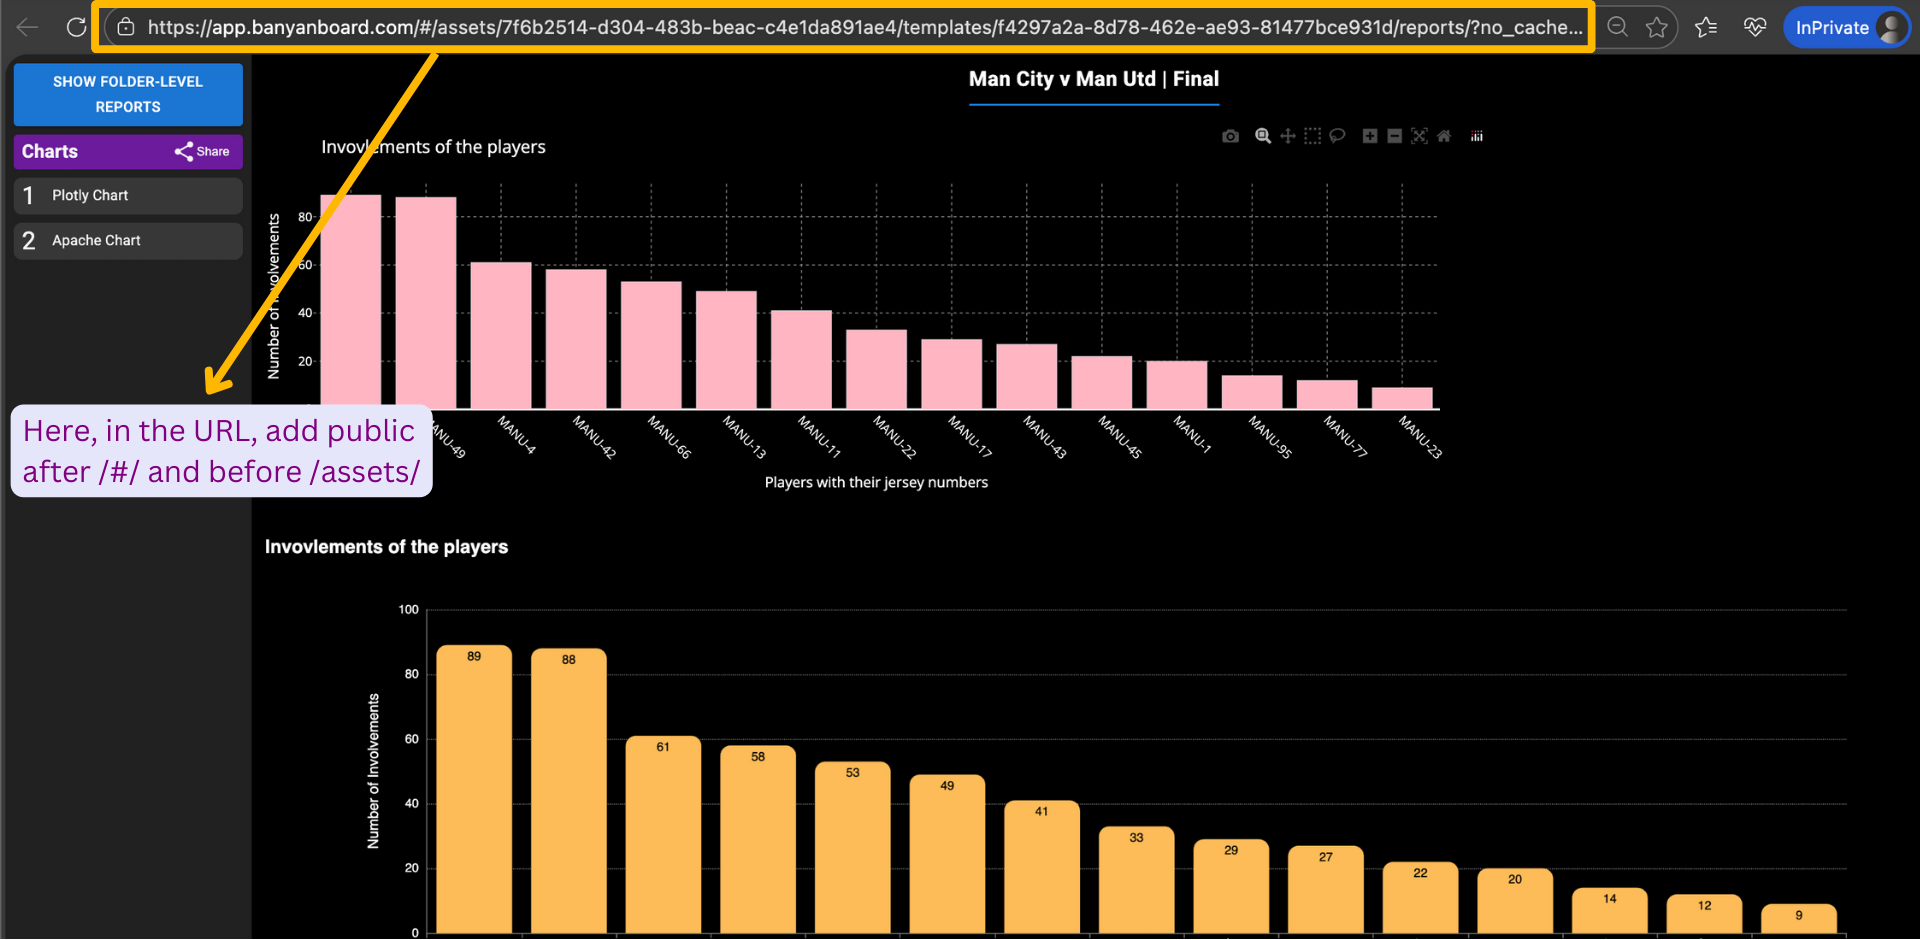
This updated URL, as shown below, which includes public after /#/ and before /assets/, is a publicly shareable link. You can copy this URL and share it with users who do not have a SPAN account.
Related Articles
Introduction to EZ Charts
Introduction to EZ Charts Today, many people want to visualise and understand data but building dashboards in a simple and flexible way is still a challenge. Coaches, analysts, and teams (both in sports and non-sports domains) often want to create ...Open EZ Charts window
EZ Charts are specific to a template. In this article, you will learn how to open EZ Charts window from templates page. Before you begin To learn how to create a template in SPAN sports performance analysis platform, refer to this article. Open EZ ...Access EZ Charts for a file
In this article, you will learn how to access EZ Charts for a file. Before you begin To learn how to create a template in SPAN sports performance analysis platform, refer to this article. To learn basics of video tagging in SPAN sports performance ...Generating Plotly charts
Plotly is a set of open-source charting libraries that help you create interactive, web-ready charts (like bar charts, line charts, scatter plots, heatmaps, and even 3D charts). Plotly charts are designed for modern dashboards and reports: users can ...Share file and annotation
In this article, you will learn how to share a file and annotation. Before you begin To add files, refer to this article. To learn how to create captions in SPAN sports performance analysis platform, refer to this article. Sharing file To share a ...